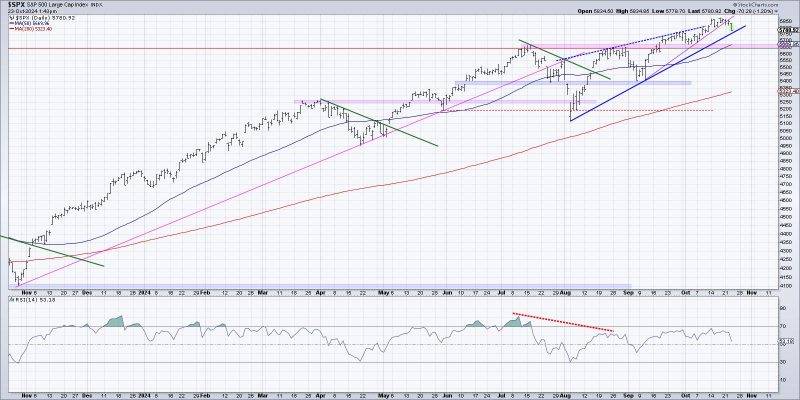
Visualizing the Start of a Potential Distribution Phase
Method 1: Volume Analysis
One effective way to visualize the start of a potential distribution phase is through volume analysis. By observing the volume of trading activity, traders can gain valuable insights into the market dynamics. During a distribution phase, volumes may start to decrease as investors become hesitant and uncertain about the future direction of the asset. This decline in volume can be a strong indicator that accumulation is slowing down and distribution is beginning.
Traders can use various technical indicators such as volume bars and moving averages to track the changes in volume over time. A divergence between price movement and volume can also signal potential distribution. For instance, if prices are rising while volume is decreasing, it may indicate that the market is becoming overbought and that a distribution phase could be on the horizon.
Method 2: Price-Volume Analysis
Another method to visualize the start of a potential distribution phase is through price-volume analysis. By analyzing the relationship between price movements and trading volumes, traders can identify potential distribution patterns early on. In a distribution phase, prices may start to plateau or show signs of weakness, accompanied by decreasing trading volumes. This divergence between price and volume can indicate that the market sentiment is shifting from accumulation to distribution.
Traders can use various charting techniques such as volume profile analysis and on-balance volume (OBV) indicators to track price-volume relationships. An increase in selling pressure accompanied by lower trading volumes can be a strong signal of distribution. By understanding the interplay between price and volume, traders can make more informed decisions about their trading strategies during potential distribution phases.
Method 3: Candlestick Patterns
Candlestick patterns can also be an effective tool for visualizing the start of a potential distribution phase. Specific candlestick patterns such as shooting stars, bearish engulfing patterns, and evening stars can indicate that the market sentiment is turning bearish and that distribution may be beginning. These patterns typically represent a shift in momentum from buyers to sellers, signaling a potential distribution phase.
Traders can use candlestick pattern recognition tools and combine them with other technical indicators to confirm potential distribution signals. By keeping an eye out for these specific candlestick patterns, traders can better anticipate market reversals and adjust their trading strategies accordingly. Understanding the nuances of candlestick patterns can provide traders with a deeper insight into market sentiment and help them navigate potential distribution phases more effectively.
In conclusion, visualizing the start of a potential distribution phase is crucial for traders looking to stay ahead of market trends and make informed trading decisions. By employing methods such as volume analysis, price-volume analysis, and candlestick patterns, traders can gain valuable insights into market dynamics and identify early signs of distribution. By incorporating these visualization techniques into their trading strategies, traders can better navigate potential distribution phases and maximize their profitability in the ever-changing financial markets.

