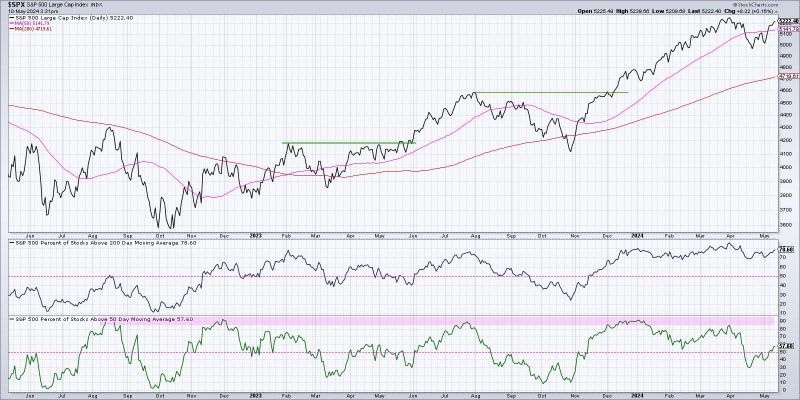
Three Breadth Indicators to Confirm a Bullish Market Trend
Market breadth indicators are essential tools for traders and investors to gauge the overall health and direction of the financial markets. These indicators offer valuable insights into the underlying strength or weakness of a market trend by analyzing the number and volume of advancing and declining assets. When combined with other technical analysis tools, breadth indicators can help confirm a bullish market trend and provide confidence in making informed investment decisions.
1. Advance-Decline Line (AD Line)
One of the most widely used market breadth indicators is the Advance-Decline Line (AD Line). This indicator measures the difference between the number of advancing and declining stocks on a given exchange over a specified period. A rising AD Line indicates that more stocks are advancing than declining, signaling a broad-based strength in the market. Conversely, a declining AD Line suggests increasing weakness and a potential reversal in the market trend.
To confirm a bullish market trend, traders look for the AD Line to be trending higher alongside the price of the index. If the AD Line is making new highs while the index is also rising, it indicates strong market participation and validates the upward momentum. Conversely, a bearish divergence between the AD Line and the index could signal potential weakness in the market trend.
2. New Highs-New Lows Index
The New Highs-New Lows Index is another breadth indicator that helps assess the overall breadth of market participation. This indicator compares the number of stocks reaching new highs to those hitting new lows over a specific period. A rising New Highs-New Lows Index signifies a healthy market environment with a greater number of stocks breaking out to new highs.
When confirming a bullish market trend, traders look for the New Highs-New Lows Index to be expanding, indicating a broad participation in the market rally. High readings in the New Highs-New Lows Index suggest that the market trend is likely to continue in the upward direction. Conversely, a declining New Highs-New Lows Index may signal a loss of momentum and potential weakness in the market.
3. Up Volume-Down Volume Ratio
The Up Volume-Down Volume Ratio is a breadth indicator that measures the volume of shares traded on up days versus down days. By comparing the volume of advancing stocks to declining stocks, this indicator provides valuable insights into the strength of market moves. A high Up Volume-Down Volume Ratio indicates strong buying interest and suggests a healthy market trend.
To confirm a bullish market trend, traders analyze the relationship between the Up Volume-Down Volume Ratio and price movements. A rising Up Volume-Down Volume Ratio alongside increasing prices validates the uptrend and suggests sustained buying pressure in the market. On the other hand, a declining Up Volume-Down Volume Ratio may signal diminishing interest from investors and potential weakness in the market trend.
In conclusion, market breadth indicators play a crucial role in confirming a bullish market trend and providing traders with insights into the underlying strength of the financial markets. By analyzing indicators such as the Advance-Decline Line, New Highs-New Lows Index, and Up Volume-Down Volume Ratio, investors can gain a comprehensive understanding of market breadth and make informed investment decisions. Proper interpretation and utilization of these breadth indicators can enhance trading strategies and improve overall performance in the dynamic world of finance.

