The Market Breadth Indicator You Should Be Following
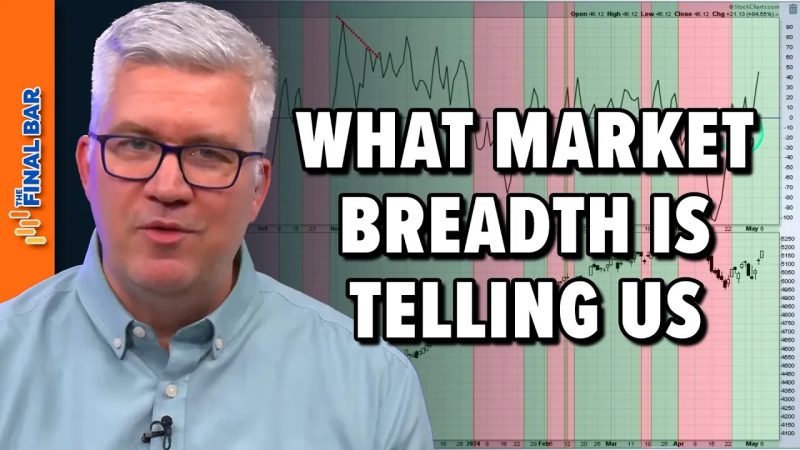
As investors navigate the complex world of financial markets, there are countless indicators to consider in order to make informed decisions. One indicator that often gets overlooked but can provide valuable insights is market breadth. Market breadth refers to the number of individual stocks participating in a market advance or decline. While many investors focus on major indices like the S&P 500 or the Dow Jones Industrial Average, market breadth indicators offer a more nuanced view of market dynamics.
One important market breadth indicator to follow is the Advance-Decline Line (AD Line). The AD Line tracks the number of advancing stocks minus the number of declining stocks on a given trading day. If the AD Line is trending higher, it indicates broad participation in the market rally, suggesting a healthy underlying market. Conversely, a declining AD Line may signal weakening market breadth and potential trouble ahead.
Another useful market breadth indicator is the McClellan Oscillator. This indicator measures market breadth by analyzing the difference between advancing and declining issues over a period of time. The McClellan Oscillator helps investors identify overbought or oversold conditions in the market and can be a valuable tool for timing entry or exit points.
Investors can also look at the new highs-new lows index to gauge market breadth. This indicator compares the number of stocks hitting new highs versus new lows. A high number of new highs relative to new lows suggests a strong market, while a high number of new lows may indicate weakness.
One advantage of monitoring market breadth indicators is that they can provide early warnings of potential market reversals. For example, if the major indices are reaching new highs but market breadth indicators are showing weakness, it could signal a divergence and a possible correction on the horizon. By paying attention to market breadth, investors can better assess the overall health of the market and make more informed investment decisions.
In conclusion, while major indices like the S&P 500 are important benchmarks for the overall market, paying attention to market breadth indicators can provide valuable insights into market dynamics. By following indicators such as the AD Line, McClellan Oscillator, and new highs-new lows index, investors can gain a deeper understanding of market breadth and potentially spot opportunities and risks earlier. In a market where timing is crucial, market breadth indicators can be a powerful tool in an investor’s toolkit.

