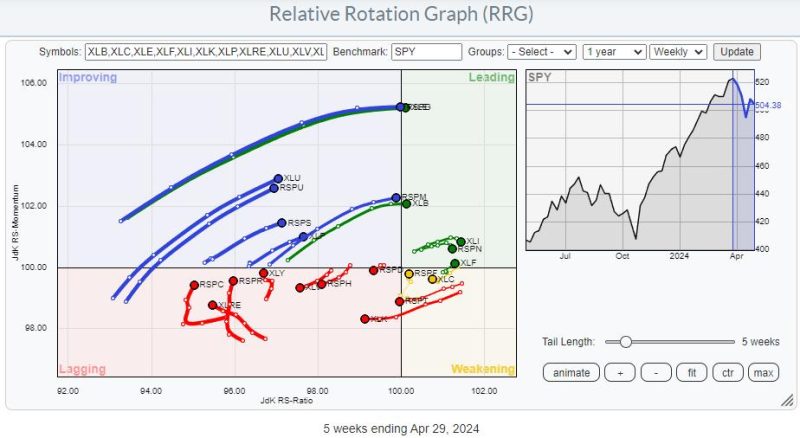
Upon analyzing a Relative Rotation Graph (RRG), investors gain crucial insights into the relative performance of various assets or securities compared to a common benchmark. The RRG employs a unique visual representation to show the rotational patterns of different assets and their relative strength in comparison to a reference index. By observing the direction and speed of rotation, market participants can identify potential trading opportunities and make more informed investment decisions.
The RRG chart consists of four quadrants, each indicating distinct trends for the assets being analyzed:
1. Leading (Strong Momentum): Assets in this quadrant are outperforming the benchmark index with strong positive momentum. They are typically desirable for investors seeking high returns and are considered to be in an uptrend.
2. Weakening (Losing Momentum): Assets in this quadrant are still outperforming the benchmark but are experiencing a decrease in momentum. Investors should closely monitor these assets as they may soon enter the lagging quadrant.
3. Lagging (Weak Performance): Assets in this quadrant are underperforming the benchmark index with weak momentum. Investors may consider reducing or eliminating positions in these assets to mitigate potential losses.
4. Improving (Building Momentum): Assets in this quadrant are underperforming the benchmark but are showing signs of improvement in momentum. These assets may present opportunities for investors to buy low before they potentially enter the leading quadrant.
By analyzing the diverging tails on an RRG chart, investors can identify assets that are moving in different directions relative to the benchmark index. This can signal potential trading opportunities based on the rotation of assets between the quadrants. For instance, if an asset’s tail is moving from the leading quadrant towards weakening, it may indicate a potential trend reversal and signal a time to consider selling that asset.
Moreover, the distance of an asset’s tail from the center of the RRG chart can provide insights into the volatility of its performance. Assets with tails positioned far from the center exhibit higher volatility and may present more significant trading opportunities for investors looking to capitalize on price movements.
In conclusion, Relative Rotation Graphs offer a comprehensive visual representation of the relative strength and momentum of various assets compared to a benchmark index. By closely monitoring the rotational patterns and diverging tails on an RRG chart, investors can identify potential trading opportunities and make well-informed decisions to optimize their investment portfolios.

