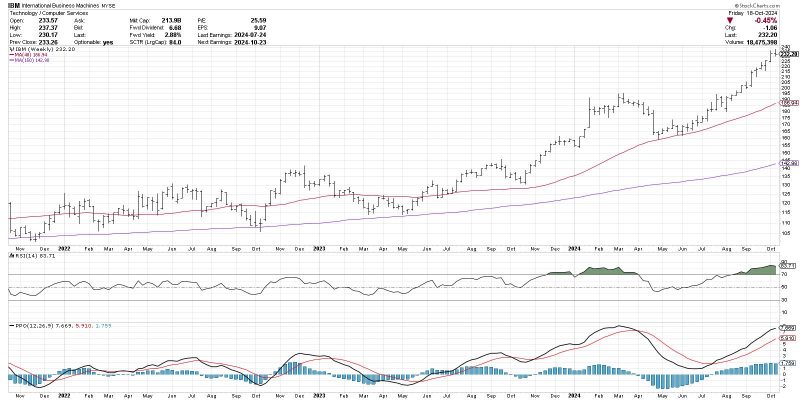
The MACD Histogram: A Powerful Tool for Anticipating Trend Changes
Understanding market trends and predicting potential changes is a crucial aspect of successful trading. Traders are constantly seeking tools and indicators that can help them anticipate these shifts effectively. One such tool that has gained popularity in the financial markets is the MACD Histogram.
The Moving Average Convergence Divergence (MACD) Histogram is a technical indicator derived from the MACD, which is widely used to identify bullish or bearish trends, as well as potential trend reversals. The MACD Histogram, in particular, offers more detailed insights by measuring the difference between the MACD line and the signal line. This crucial distinction can provide traders with early indications of potential trend changes, offering them a competitive edge in the market.
The movement of the MACD Histogram above or below the zero line serves as a key signal for traders. When the MACD Histogram moves above the zero line, it indicates a bullish trend, suggesting that the market momentum is shifting in favor of buyers. Conversely, when the MACD Histogram falls below the zero line, it signals a bearish trend, indicating that sellers are gaining control.
One of the significant advantages of using the MACD Histogram is its ability to provide actionable insights ahead of potential trend changes. By monitoring the histogram’s movements and observing divergences from price action, traders can anticipate shifts in market sentiment and make informed decisions accordingly. This proactive approach can help traders enter positions at optimal levels and maximize their profitability.
Moreover, the MACD Histogram can be a valuable tool for confirming trend reversals identified by other technical indicators. By cross-referencing signals from the MACD Histogram with those from trend lines, moving averages, or other oscillators, traders can enhance their confidence in their trading decisions and reduce the risk of false signals.
While the MACD Histogram can be a powerful tool in anticipating trend changes, it is essential for traders to use it in conjunction with other technical analysis tools and risk management strategies. Like any indicator, the MACD Histogram is not foolproof and should be used as part of a comprehensive trading plan.
In conclusion, the MACD Histogram holds the potential to be a highly effective tool for traders seeking to anticipate trend changes in the financial markets. By interpreting the movements of the histogram and integrating its signals with other technical indicators, traders can enhance their decision-making process and stay ahead of market trends. With proper implementation and a disciplined approach, the MACD Histogram can be a valuable asset in a trader’s toolkit.

